

Worried About Your Home’s Value? Here’s What the Headlines Aren’t Saying
Hearing claims that home prices are falling? It’s natural to wonder if your home’s value is slipping. Here’s the key takeaway: while a few local markets have seen minor dips this year, prices are not declining nationwide—so the headlines don’t tell the whole story.
Most of the country is still seeing home prices move higher.
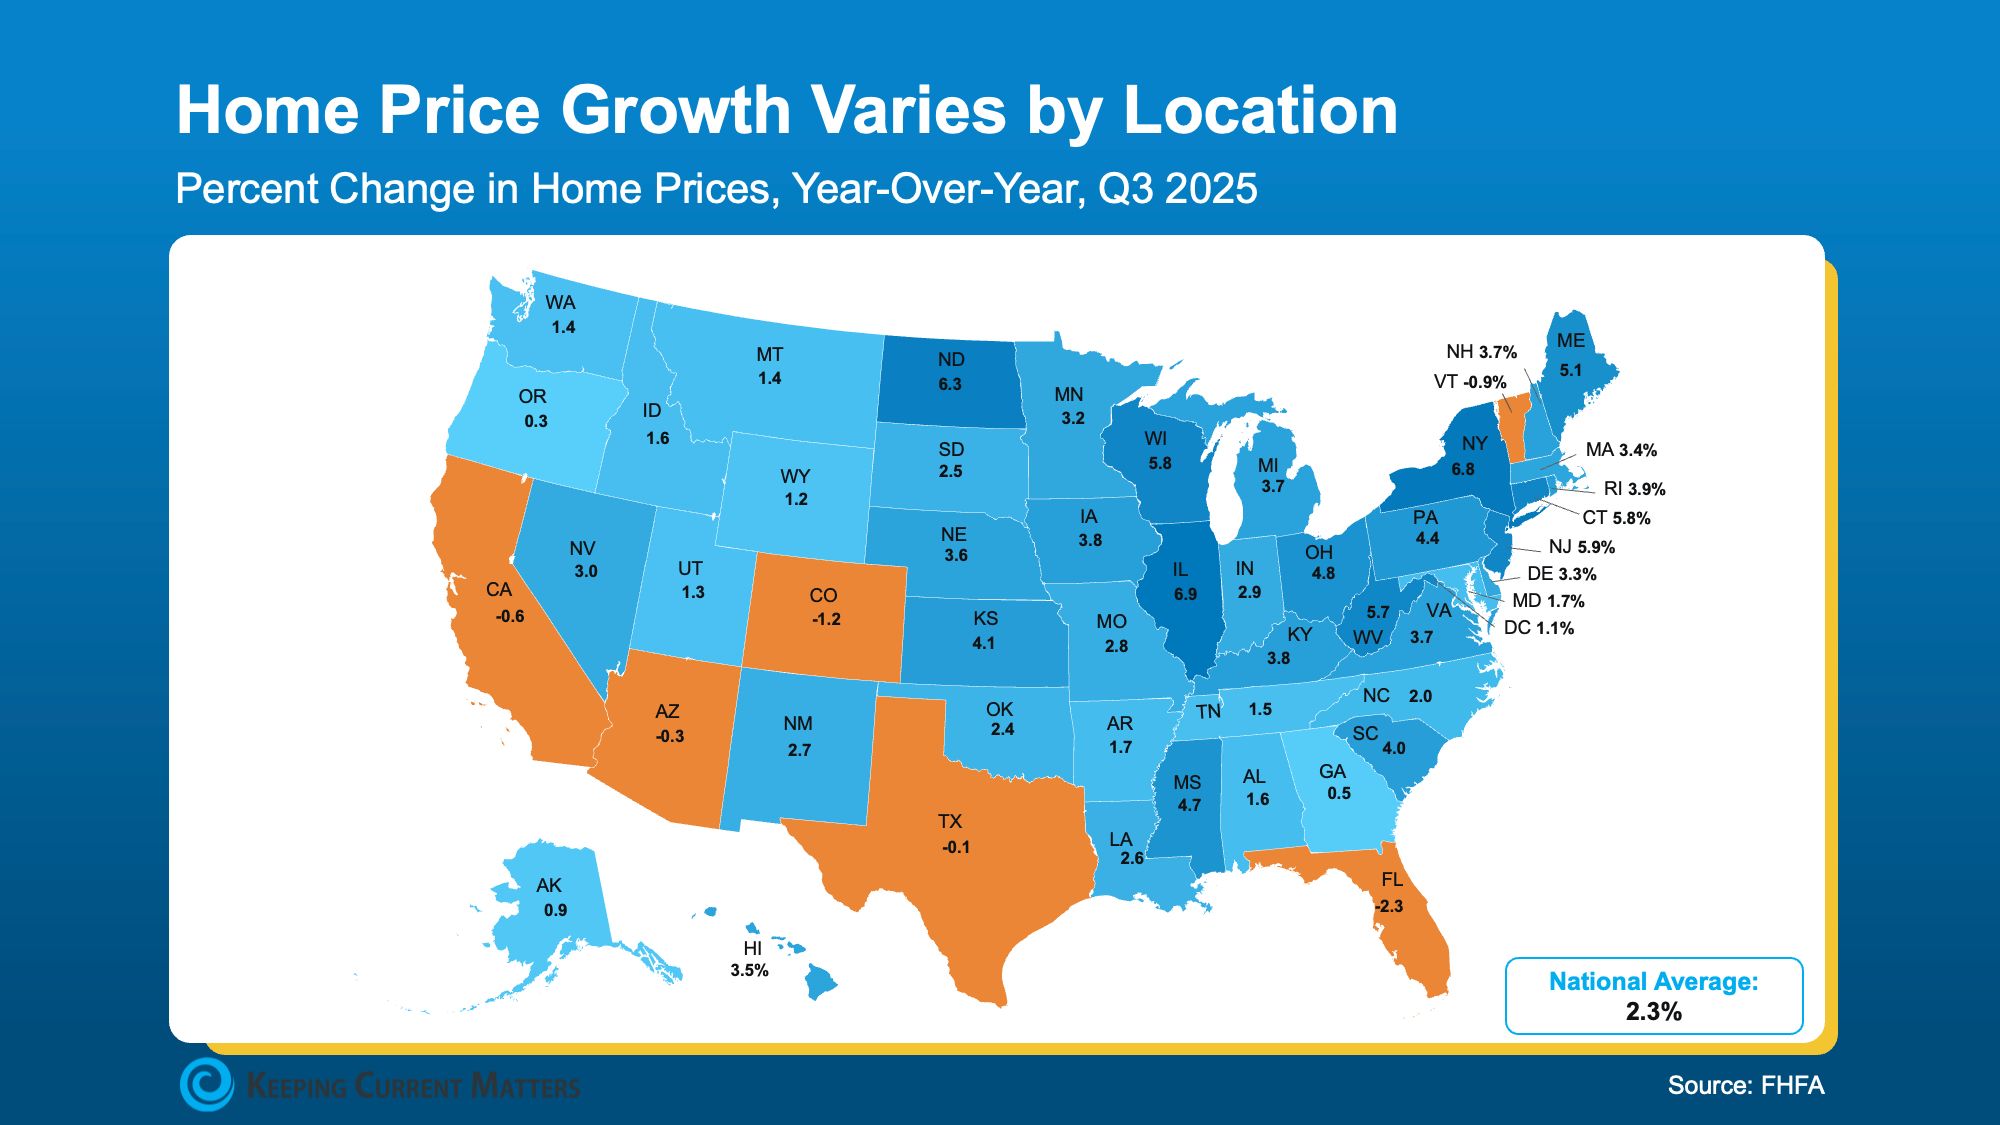
That may sound surprising given recent headlines, but the map below—based on year-over-year data from the Federal Housing Finance Agency (FHFA)—shows exactly where values are rising.
Here’s what the data actually tells us.
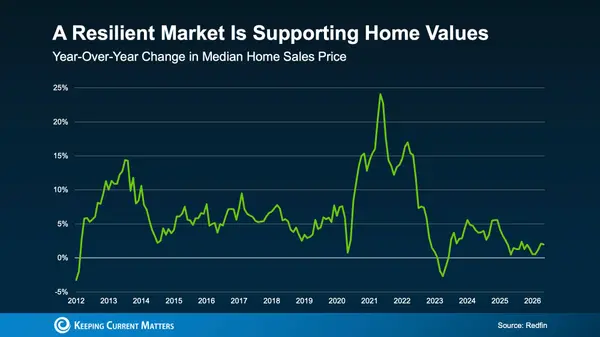
Most states are seeing home prices increase—the blue on the map—not decline. While the pace of growth has cooled compared to recent years, prices are still moving higher. That’s why National Association of Realtors (NAR) data shows national home prices up 2.1% year over year.
The headlines rarely focus on that. They tend to spotlight the negative—and even that isn’t as dire as it sounds. Yes, a handful of states have seen home values decline over the past 12 months (shown in orange on the map). That’s what much of the conversation latches onto. But the data tells a more complete story.
These declines aren’t widespread. And in the few states where prices have edged lower, the pullbacks are modest—generally ranging from about -0.1% to -2%.
Those states are the ones that saw prices surge the fastest during the pandemic boom. A pullback was always likely after that kind of run-up—and that’s what we’re seeing now. Prices in those markets are settling, which points to normalization, not a collapse.
Bottom line: Home prices aren’t crashing. This isn’t a warning sign of broader trouble.
Most Homeowners Still Hold Significant Value
To reinforce the point, here’s one more reassuring stat. Even in the small number of markets where prices have dipped slightly, most homeowners are still well ahead. Zillow data makes that clear:
- Only about 4% of homes are worth less than their original purchase price
- 96% of homes are still worth more than what their owners paid
Don’t just take that at face value—look at the longer view. When you step back and examine home price growth over the past five years, it becomes clear why so many homeowners remain in a strong position.
Nationally, home prices are up nearly 49% over the last five years, with almost every market posting double-digit gains during that period. That’s why you won’t see any orange on the map below.
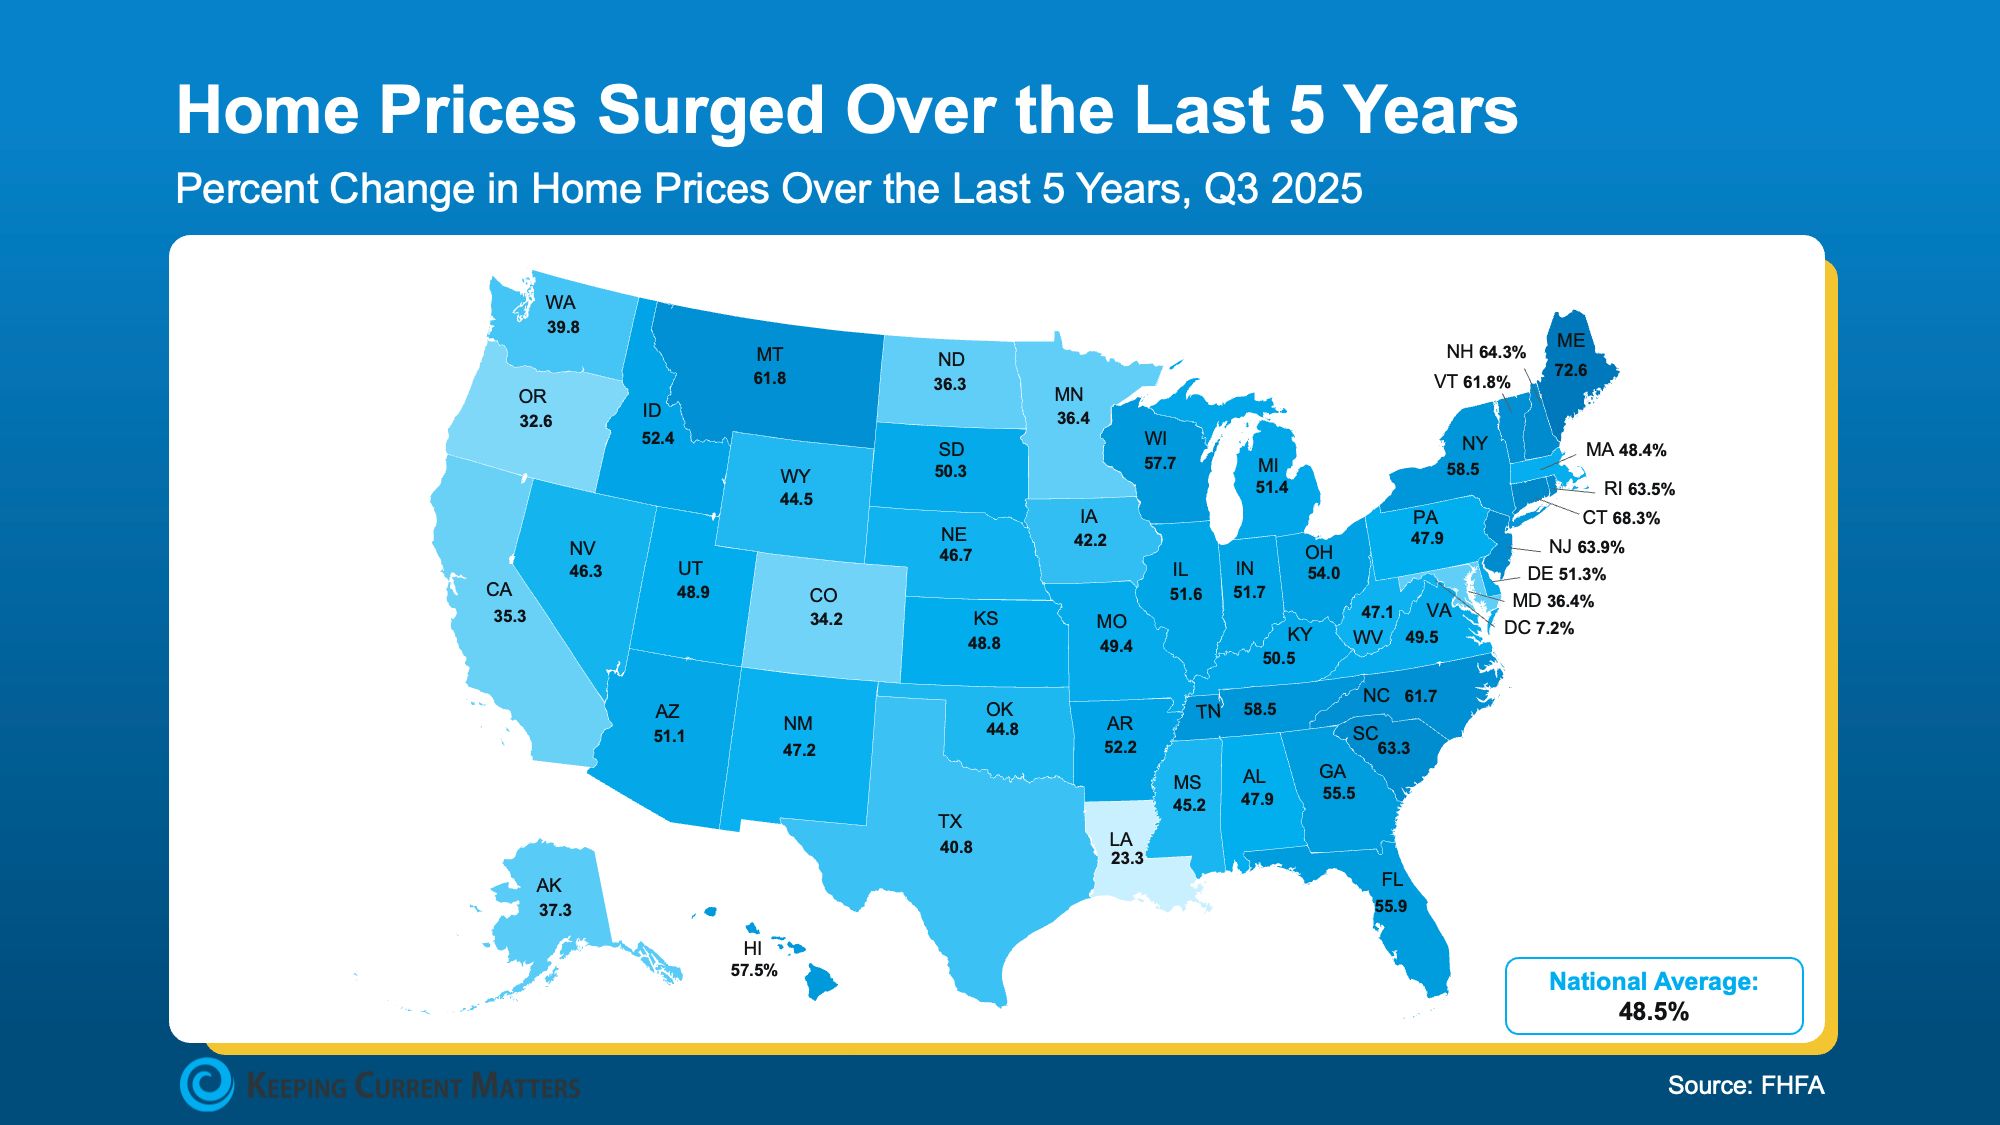
The reality is most homeowners are still sitting on significant gains. Against that backdrop, the -0.1% to -2% declines seen in a few states are easily absorbed.
So don’t let the headlines drive the narrative. Home price trends vary widely by location, but the takeaway is simple: a modest dip in select markets does not mean your home’s value is collapsing. It reflects normal market adjustments—often in areas that experienced the sharpest pandemic-era growth. Chances are, you’re still in a very strong position.
Bottom Line
If headlines about price drops or crashes have you uneasy, the data provides needed perspective. Declines are limited to a small number of markets, while most of the country is still seeing prices rise. And for the vast majority of homeowners, long-term appreciation far outweighs any recent softening.
To understand what this means for your specific area, connect with a local real estate professional.
{ "@context": "https://schema.org", "@type": "FAQPage", "mainEntity": [ { "@type": "Question", "name": "Are home prices actually falling?", "acceptedAnswer": { "@type": "Answer", "text": "Not on a national basis. National Association of Realtors data shows the U.S. median existing-home price in October was up 2.1% year over year, marking the 28th straight month of annual price gains. Some individual markets have softened, but that’s very different from a broad nationwide decline in values." } }, { "@type": "Question", "name": "Why do the headlines make it sound so bad?", "acceptedAnswer": { "@type": "Answer", "text": "Headlines often spotlight the areas where prices are down—not the many places they’re still rising—because negative stories grab attention. In reality, national price indexes from major sources like NAR and the FHFA still show year-over-year gains, even if the pace is slower than during the pandemic." } }, { "@type": "Question", "name": "How widespread are actual price declines?", "acceptedAnswer": { "@type": "Answer", "text": "Price growth has cooled and some markets or states are seeing small year-over-year dips, often in the range of roughly flat to low single-digit declines. Those softer markets are typically the ones that had the sharpest run-up in 2020–2022, so what you’re seeing now is more normalization than a crash." } }, { "@type": "Question", "name": "If values in my area dipped, should I panic?", "acceptedAnswer": { "@type": "Answer", "text": "Usually, no. Small pullbacks of a couple percentage points are often manageable compared with the large gains of the past several years. Many owners bought before or early in the pandemic surge, so even a modest recent decline often still leaves them with substantial equity versus what they originally paid." } }, { "@type": "Question", "name": "Are most homeowners still ahead of what they paid?", "acceptedAnswer": { "@type": "Answer", "text": "Yes. Even where online estimates have come down, only a small share of owners actually sell for less than what they paid. Zillow-related data shows a minority of homes sell at a loss versus the prior purchase price, while the overwhelming majority still close at or above the owner’s original price." } }, { "@type": "Question", "name": "How much have home prices grown over the last five years?", "acceptedAnswer": { "@type": "Answer", "text": "National home price indexes show strong cumulative appreciation over the last five years—total growth in the double digits and far larger than the small moves seen over the past year. That longer-term growth is a big reason most owners are still in a favorable equity position, even if their local market has cooled recently." } }, { "@type": "Question", "name": "What’s the difference between a “dip” and a “crash”?", "acceptedAnswer": { "@type": "Answer", "text": "A dip is a modest move—often single-digit changes over a year or so—usually tied to mortgage rates and local supply-and-demand shifts. A crash would mean steep, broad-based double-digit declines across many markets, and current national data does not show that." } }, { "@type": "Question", "name": "Why are some markets softening more than others?", "acceptedAnswer": { "@type": "Answer", "text": "Markets that saw the fastest pandemic-era price spikes—often in parts of the West and South—are more likely to see adjustments as affordability stretches and inventory builds. Areas with tighter supply and steadier demand are more likely to see prices hold firm or edge higher instead of falling." } }, { "@type": "Question", "name": "What if my Zestimate or online value just dropped?", "acceptedAnswer": { "@type": "Answer", "text": "Online estimates can be helpful, but they can also swing month to month and don’t always match what buyers will pay. A small algorithm change doesn’t mean you lost that amount of real equity overnight—true market value is driven by recent comparable sales and current buyer demand in your neighborhood." } }, { "@type": "Question", "name": "How can I find out what my home is really worth right now?", "acceptedAnswer": { "@type": "Answer", "text": "The most reliable method is a local market analysis based on recent comparable sales, current competition, and today’s buyer demand in your specific area. A local real estate professional who tracks your neighborhood closely can give you a clear, data-backed estimate of what your home could sell for right now." } } ] }
Categories
Recent Posts
GET MORE INFORMATION
