

Seeing More Foreclosure News? Here’s the Context the Headlines Miss

If you’ve noticed headlines claiming foreclosure activity has risen for 10 straight months, it’s easy to jump to worst-case conclusions. But when you step back and look at the broader data, a few key facts stand out:
- Foreclosure levels remain within historical norms
- Strong home equity continues to protect most homeowners
- There’s no evidence pointing to a surge of distressed sales that would destabilize the market
Foreclosure Filings Are Up 32%—Why That’s Not a Warning Sign
When you strip away the headlines, the real fear is a replay of 2008. That crash was driven by loose lending standards and too many homes hitting the market at once, which pushed prices down and fueled a surge in foreclosures. Today’s conditions are fundamentally different—and the data doesn’t support that comparison.
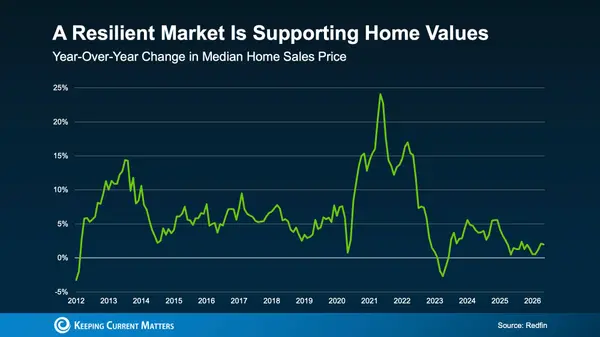
Yes, ATTOM data shows foreclosure filings are up 32% year over year. That sounds alarming on the surface, but context changes the story. This increase doesn’t signal another crash—and the data makes that clear. Compare today’s levels (shown in blue) to the last housing crisis (shown in red).
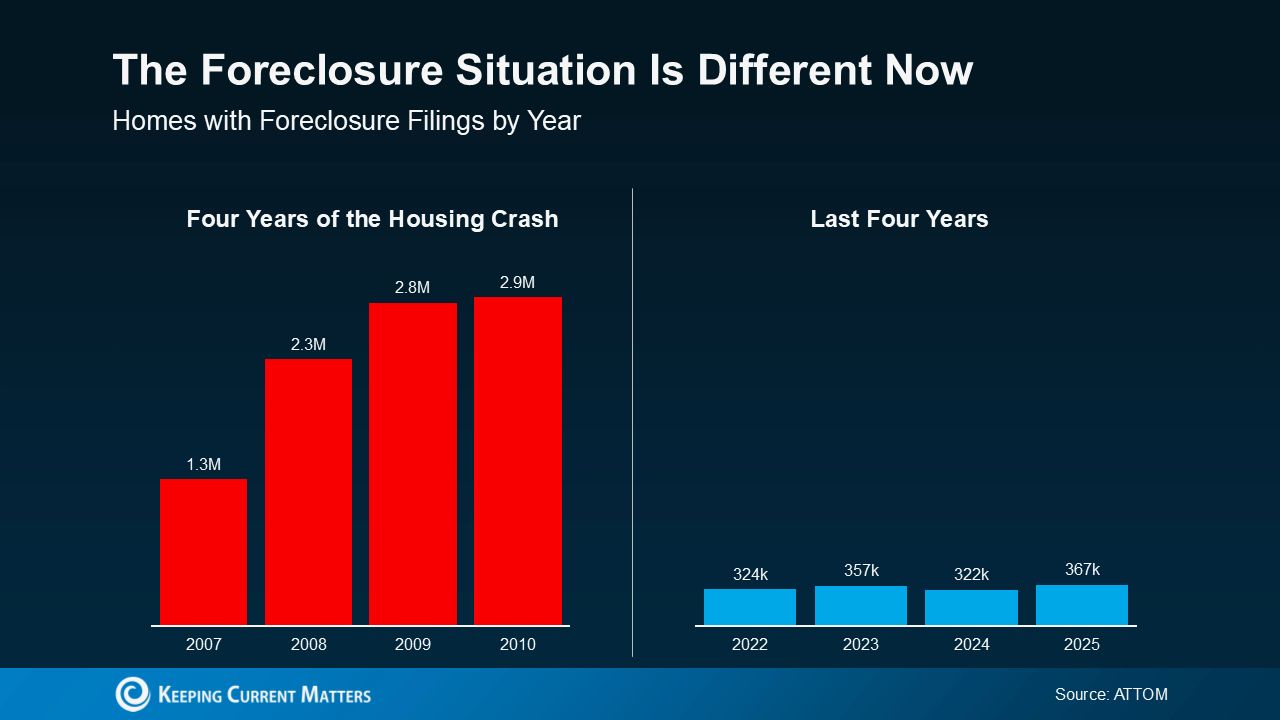
Yes, there’s been an uptick. But we’re still nowhere close to crash territory. This isn’t a crisis comeback—it’s the market settling back into normal patterns.
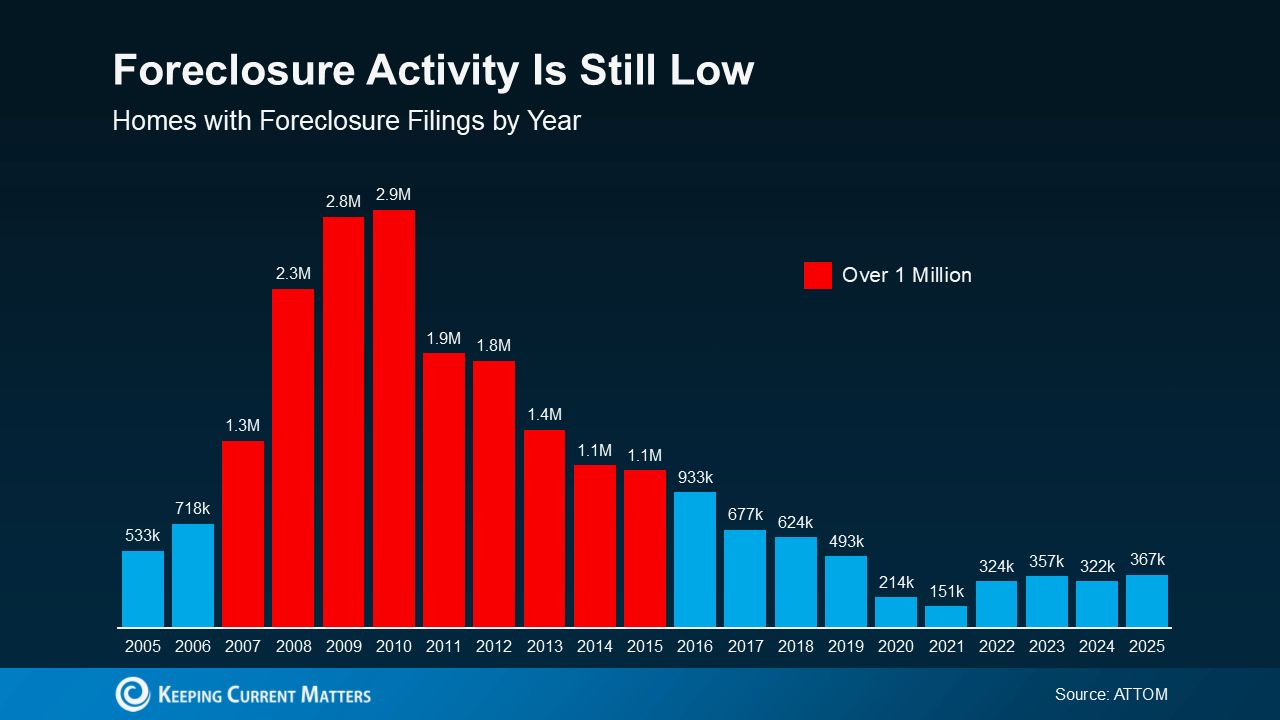
The chart below tracks foreclosure filings back to early 2005. The run-up to the housing crash—and its aftermath—appears in red, when annual filings consistently exceeded one million. Now shift your focus to the right side of the chart and look at the 2017–2019 period, the last stretch of a truly normal housing market. Even with the recent increase, today’s numbers are simply moving back toward those historical norms.
ATTOM CEO Rob Barber sums it up clearly:
“Foreclosure activity increased in 2025 as the housing market continues to normalize after years of unusually low levels. While filings, starts, and repossessions rose compared to 2024, activity remains well below pre-pandemic norms—and only a fraction of what occurred during the last housing crisis. Today’s increase reflects market recalibration, not widespread homeowner distress, as strong equity positions and disciplined lending continue to limit risk.”
The key word in that quote is normalization. While economic and financial pressures are affecting some homeowners, this isn’t a surge of distressed properties. Despite what the headlines suggest, this is not a large-scale crisis.
The recent increase doesn’t signal trouble—it reflects a return to normal market conditions.
Why Today’s Market Isn’t 2008 All Over Again
The last housing crash still influences how many people read today’s headlines—but the fundamentals are very different this time around:
- Lending standards are significantly tighter
- Borrowers are more qualified
- Homeowners are sitting on far more equity
Equity is the critical difference. Home values have climbed sharply over the past five years, leaving many homeowners with properties worth far more than their purchase price. That equity acts as a financial buffer.
If a homeowner runs into hardship, selling is often an option—and in many cases, they can walk away with cash rather than face foreclosure. That’s a stark contrast to 2008, when millions owed more than their homes were worth.
Bottom Line
Foreclosure activity may be trending higher, but it remains well within normal historical ranges—nowhere near the danger zones of the past. The problem isn’t the data; it’s the headlines, which often create fear without context. That’s why having a trusted real estate expert matters.
When housing news raises concerns, a local agent can break down what’s actually happening and explain how it affects you, if at all.
{ "@context": "https://schema.org", "@type": "FAQPage", "mainEntity": [ { "@type": "Question", "name": "I keep seeing headlines that foreclosures are rising for months in a row. Should I be worried about a new housing crash?", "acceptedAnswer": { "@type": "Answer", "text": "Not necessarily. Recent data shows foreclosure activity has risen for several consecutive months, but overall levels are still within normal historical ranges and remain far below the peaks of the last housing crisis. Source: https://www.attomdata.com/news/market-trends/foreclosures/2025-year-end-foreclosure-market-report/" } }, { "@type": "Question", "name": "If foreclosure filings are up, does that mean the housing market is in serious trouble?", "acceptedAnswer": { "@type": "Answer", "text": "No. The increase reflects the market normalizing after years of unusually low foreclosure activity, not a wave of distressed sellers like we saw in 2008. Source: https://www.attomdata.com/news/market-trends/foreclosures/2025-year-end-foreclosure-market-report/" } }, { "@type": "Question", "name": "Are we seeing the kinds of conditions that led to the 2008 crash?", "acceptedAnswer": { "@type": "Answer", "text": "Today’s market is very different: lending standards are tighter, borrowers are generally more qualified, and most homeowners have significantly more equity than they did before the last crash. Source: https://www.newyorkfed.org/medialibrary/media/research/staff_reports/sr882.pdf" } }, { "@type": "Question", "name": "I heard foreclosure filings are up 32% year over year. Isn’t that a red flag?", "acceptedAnswer": { "@type": "Answer", "text": "That 32% jump refers to fourth-quarter filings compared to a year earlier, but even with that increase, activity is still below pre-pandemic levels and a fraction of what occurred during the housing crisis. Source: https://www.readysignal.com/2025-us-foreclosures-rise-what-it-means-for-2026/" } }, { "@type": "Question", "name": "How do today’s foreclosure numbers compare to the last housing crisis?", "acceptedAnswer": { "@type": "Answer", "text": "In 2025, about 367,000 properties had a foreclosure filing; that’s down about 87% from the nearly 2.9 million peak around 2010, and even about 25% below 2019, a more typical year. Source: https://www.attomdata.com/news/market-trends/foreclosures/2025-year-end-foreclosure-market-report/" } }, { "@type": "Question", "name": "So is the rise in foreclosures a sign of widespread homeowner distress?", "acceptedAnswer": { "@type": "Answer", "text": "The data suggests it’s more of a “market recalibration” than broad distress, with filings moving up from unusually low levels but still well below historic crisis territory. Source: https://www.attomdata.com/news/most-recent/foreclosure-rates-by-state/" } }, { "@type": "Question", "name": "What made 2008 so different from what we’re seeing now?", "acceptedAnswer": { "@type": "Answer", "text": "The last crash was fueled by extremely loose lending, a flood of distressed properties hitting the market at once, and many owners owing more than their homes were worth, which amplified foreclosures. Source: https://www.financialresearch.gov/working-papers/files/OFRwp-2016-05_Real-Consequences-of-Bank-Mortgage-Lending-Standards.pdf" } }, { "@type": "Question", "name": "Are lending standards still as loose as they were back then?", "acceptedAnswer": { "@type": "Answer", "text": "No. Since the crisis, lenders have generally required higher credit scores and more documentation; borrowing standards for many products remain tighter than before 2008. Source: https://www.newyorkfed.org/medialibrary/media/research/staff_reports/sr882.pdf" } }, { "@type": "Question", "name": "Are today’s buyers more financially qualified than buyers before the last crash?", "acceptedAnswer": { "@type": "Answer", "text": "In general, yes—regulatory changes and lender caution have pushed credit quality higher, meaning a larger share of borrowers can better withstand financial stress than in the pre-crisis era. Source: https://www.financialresearch.gov/working-papers/files/OFRwp-2016-05_Real-Consequences-of-Bank-Mortgage-Lending-Standards.pdf" } }, { "@type": "Question", "name": "Why is homeowner equity such a big deal when talking about foreclosures?", "acceptedAnswer": { "@type": "Answer", "text": "Equity acts as a cushion; when home values are well above the mortgage balance, many owners who hit hardship can sell rather than go into foreclosure, often walking away with cash instead of debt. Source: https://www.cotality.com/press-releases/u-s-home-equity-dips-fall-2025" } }, { "@type": "Question", "name": "Do homeowners really still have strong equity after recent price shifts?", "acceptedAnswer": { "@type": "Answer", "text": "Yes. Even with some cooling, total homeowner equity for borrowers with a mortgage is in the tens of trillions of dollars, and the average owner still has hundreds of thousands of dollars in equity. Source: https://www.cotality.com/press-releases/home-equity-growth-stalls-q2-2025" } }, { "@type": "Question", "name": "Does negative equity look anything like it did in 2008?", "acceptedAnswer": { "@type": "Answer", "text": "No. While the number of owners with negative equity has ticked up, they still represent only a small share of homeowners, far from the widespread underwater situation seen during the last crash. Source: https://www.cotality.com/press-releases/u-s-home-equity-dips-fall-2025" } }, { "@type": "Question", "name": "Will rising foreclosure numbers flood the market with distressed listings and push prices down?", "acceptedAnswer": { "@type": "Answer", "text": "Current foreclosure activity is too low to create a wave of distressed sales; it’s not enough to overwhelm demand or trigger the kind of price collapse seen in the late 2000s. Source: https://www.attomdata.com/news/most-recent/foreclosure-rates-by-state/" } }, { "@type": "Question", "name": "If I’m a homeowner, do these foreclosure headlines mean my home value is at risk?", "acceptedAnswer": { "@type": "Answer", "text": "Not directly. The current level of foreclosures is still modest relative to the overall market, and strong equity plus tighter lending standards are helping to stabilize prices. Source: https://www.cotality.com/press-releases/home-equity-growth-stalls-q2-2025" } }, { "@type": "Question", "name": "Why is it helpful to talk to a local real estate expert about foreclosure news?", "acceptedAnswer": { "@type": "Answer", "text": "A local agent can interpret national data in the context of your neighborhood, explain how (or if) broader trends affect your specific situation, and help you plan smartly whether you’re buying or selling. Source: https://www.attomdata.com/news/most-recent/foreclosure-rates-by-state/" } } ] }
Categories
Recent Posts
GET MORE INFORMATION
