

Understanding the Latest Home Price Headlines
The news may lead you to believe that home prices are dropping, but the complete picture is not accurately portrayed in the headlines.
When examining the national data for 2023, it becomes evident that home prices experienced overall positive growth for the year. Although this trend varies across different markets, and despite occasional slight declines at a national level in certain months, these instances were uncommon rather than the norm.
The main narrative is that prices increased last year, not decreased. Let's analyze the data to clarify the situation.
2023 Marked a Return to More Typical Growth in Home Prices
If anything, the previous year signaled a return to a more typical increase in home prices. To illustrate, here's what typically occurs in the residential real estate market.
The housing market experiences regular patterns of activity known as seasonality. This pattern typically involves a peak in homebuying during the spring, with the market remaining active in the summer but starting to slow down toward the year's end. Home prices align with this seasonality, as they tend to increase the most when demand is high.
The graph presented below utilizes unadjusted data from Case-Shiller to illustrate the manifestation of this pattern in home prices from 1973 to 2022.
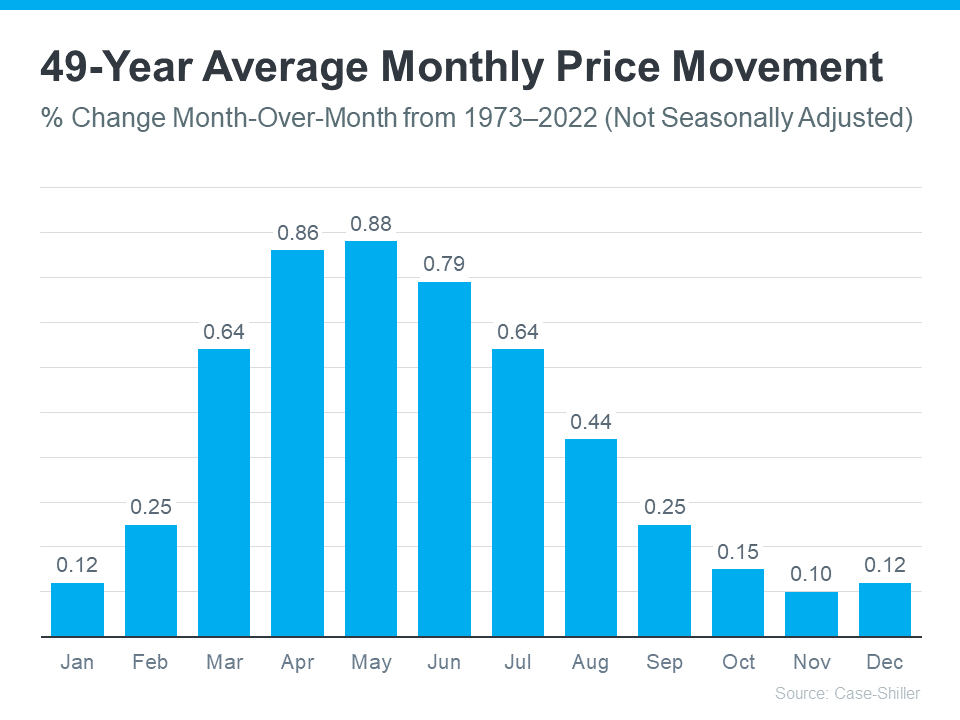
The data indicates that over almost five decades, home prices have followed the typical seasonal patterns of the market. At the start of the year, home prices experience more moderate growth, reflecting the lower market activity as fewer people move in January and February. Subsequently, as the market shifts into the peak homebuying season in spring, both activity and home prices increase. As fall and winter approach, activity eases once more, and prices continue to grow, albeit at a slower pace.
Next, we will overlay the 2023 data that has been released so far (indicated in green) onto the long-term trend (still indicated in blue). This will allow for a straightforward comparison of how 2023 measures up to the historical trend.
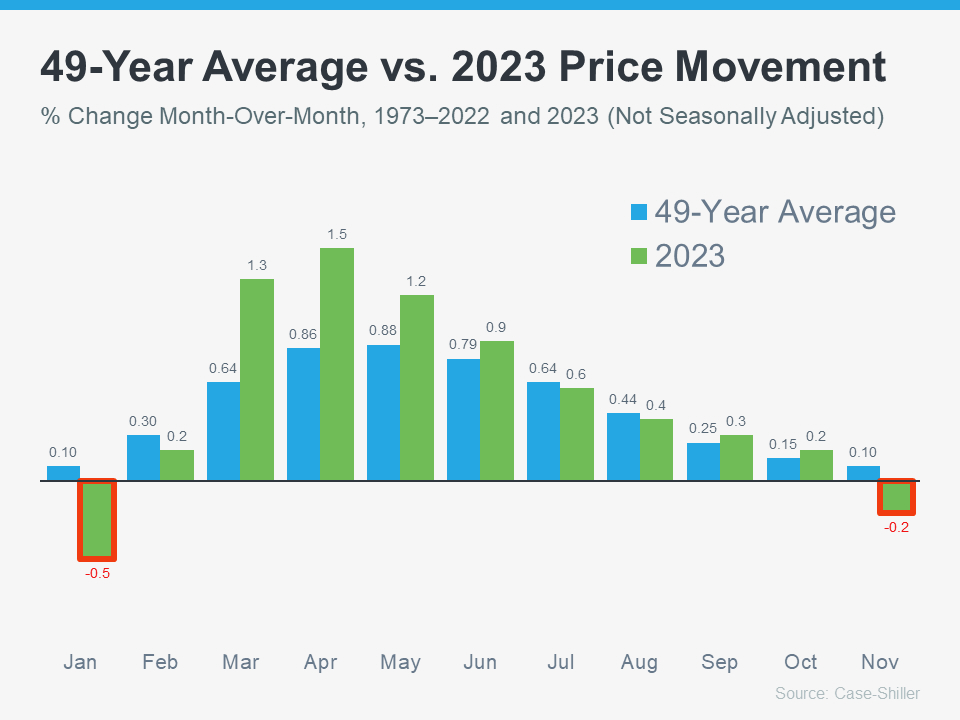
The graph illustrates that as 2023 progressed, the rate of appreciation more closely aligned with the long-term trend typical in the housing market. This is evident in how closely the green bars match the blue bars in the latter part of the year.
However, the headlines primarily emphasized the two bars highlighted in red. Here's the context that may provide a more comprehensive understanding and put those two bars into perspective. The long-term trend indicates that it's customary for home prices to stabilize in the fall and winter, reflecting typical seasonality.
Given that the 49-year average remains near zero during those periods (0.10%), it's not uncommon for home prices to experience a slight decline during those months. However, these are merely minor fluctuations. When considering the entire year, home prices still exhibited an overall increase.
Essential Information You Need to Understand
The headlines will highlight the minor month-to-month declines instead of the broader year-long perspective. This focus can be somewhat misleading as it only captures one aspect of the complete story.
Categories
Recent Posts
GET MORE INFORMATION
